Solar Shadow
By: Daniel Iván Jiménez, Muskeen Liddar, Yu-Chan ChiuWhat’s the impact of tree forest cover in cities?
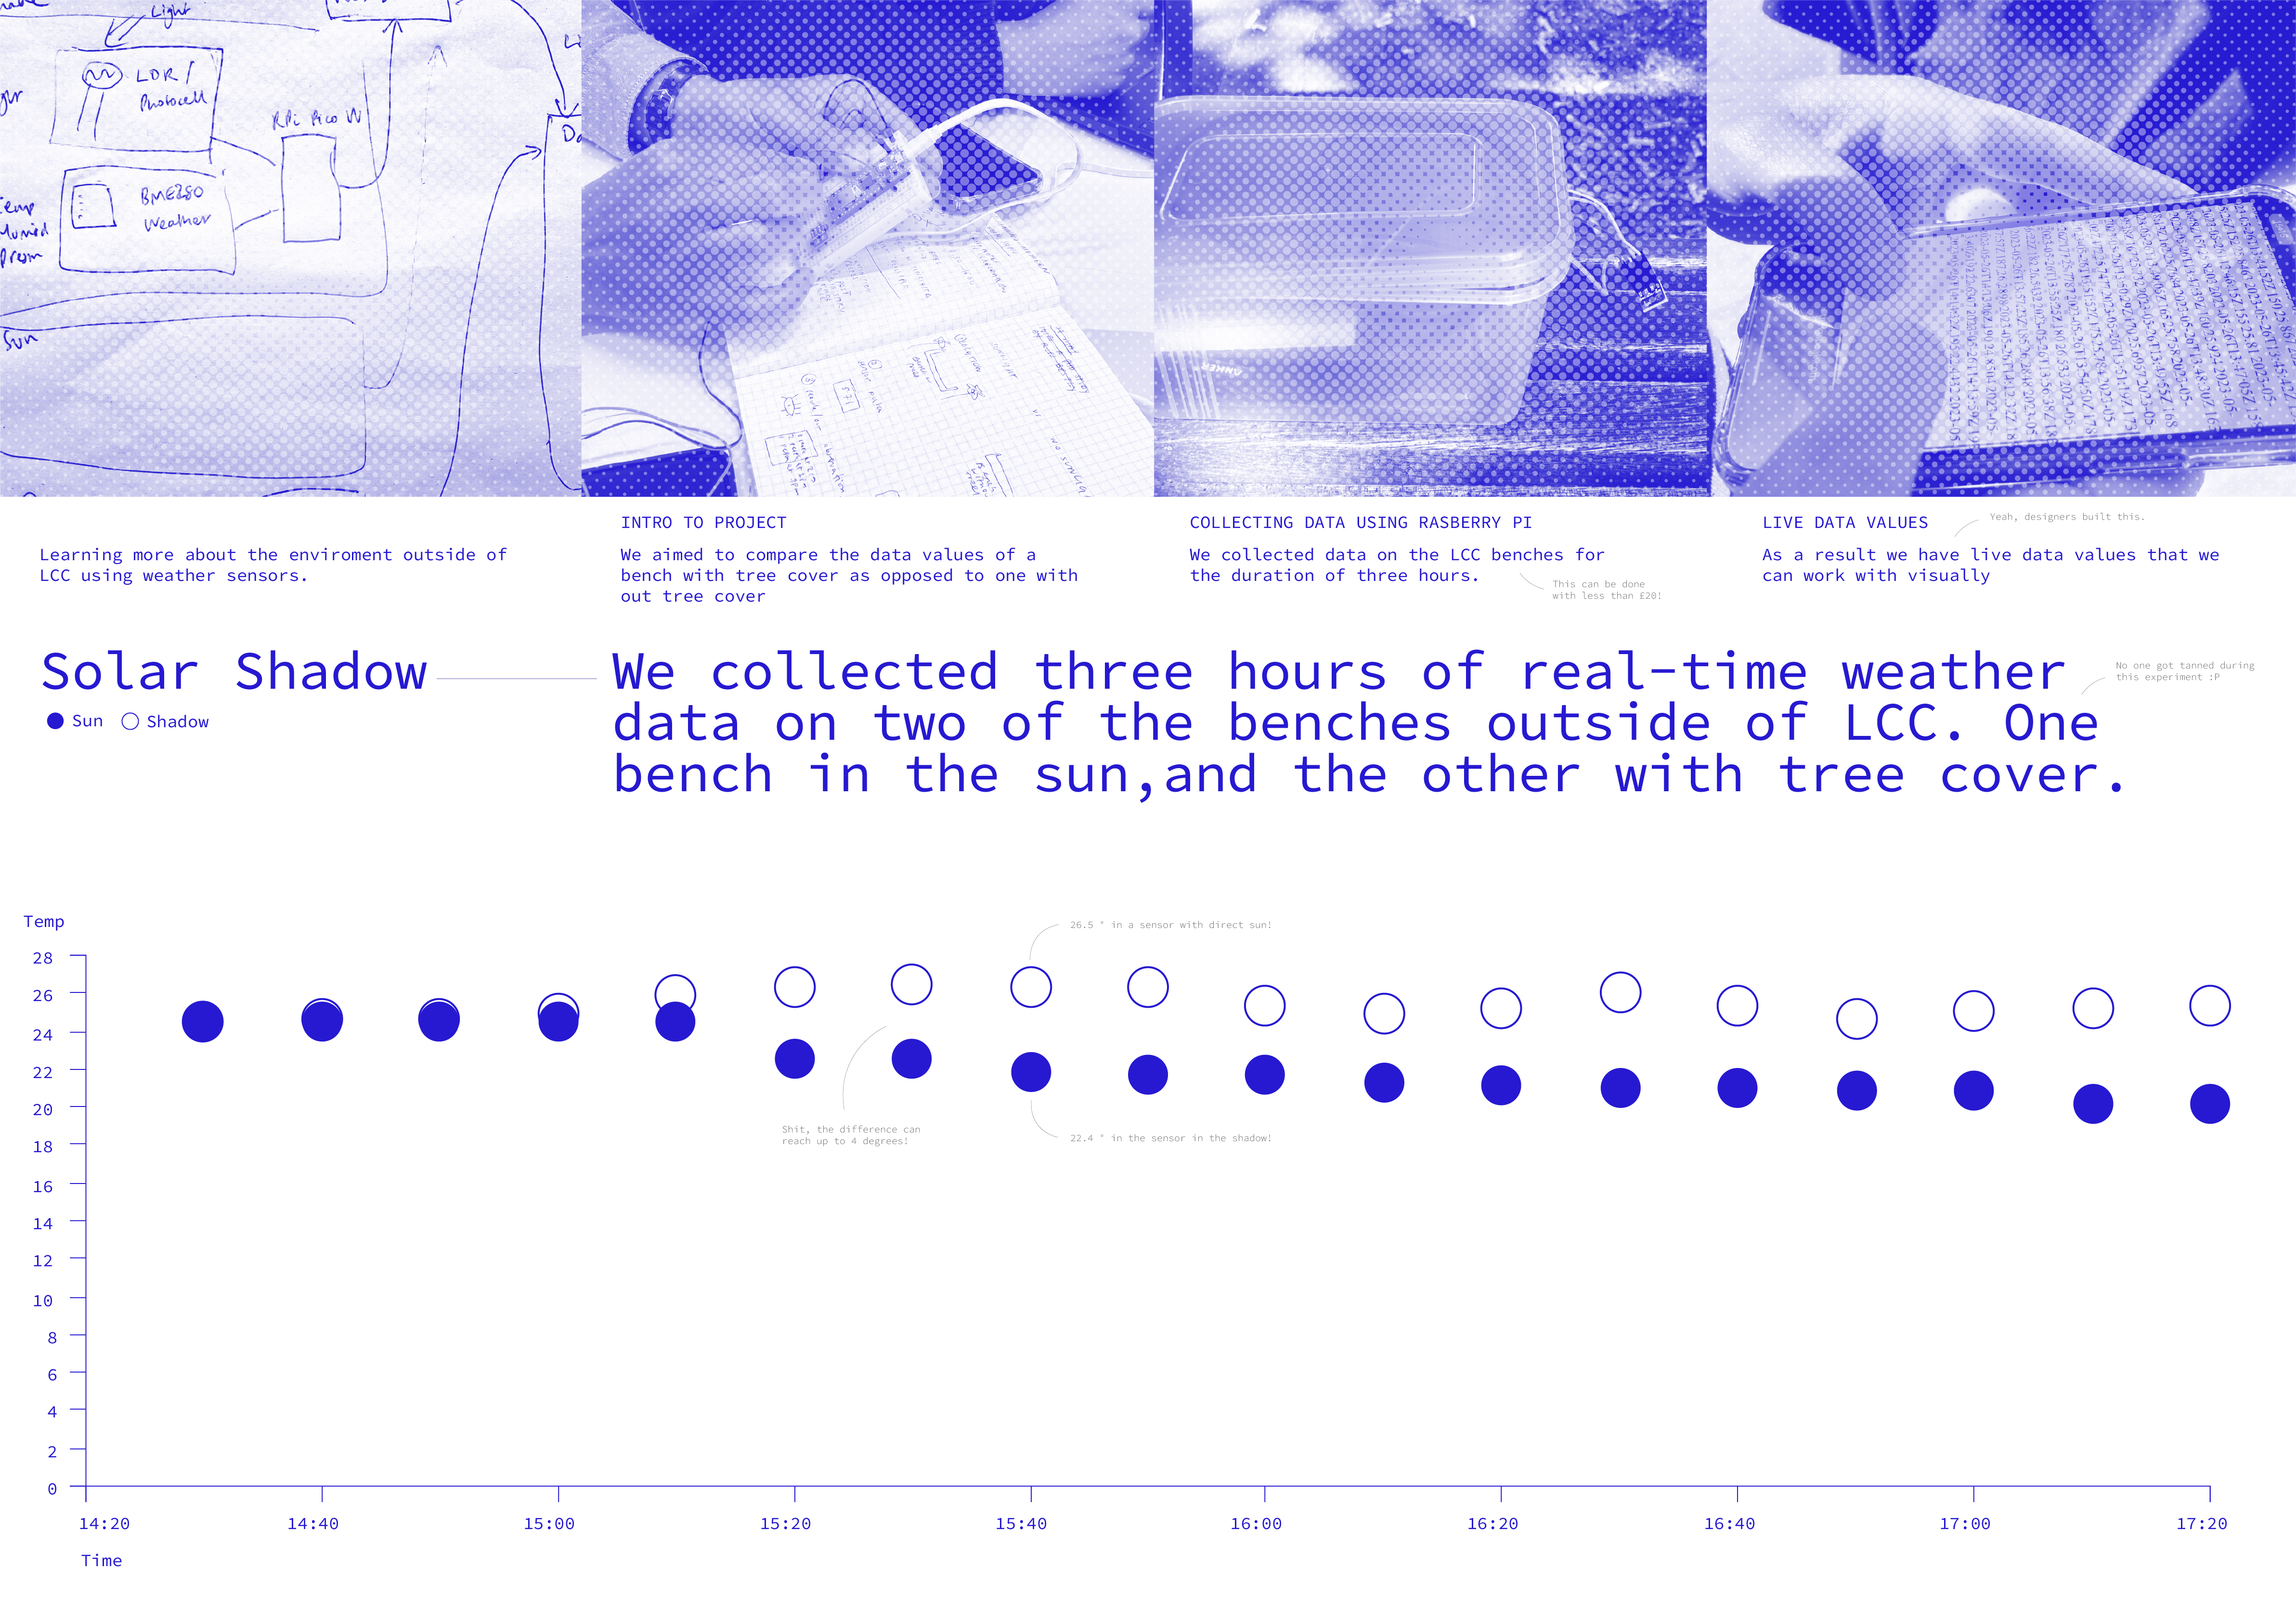
For this project, we were interested in showing how big the change is in temperature and humidity in two locations, with and without the shadow of a tree. We collected the data in front of two benches for 8 hours and created the full automated recollection process to finally create a visualization and a physical outcome.
This research breaks down the importance of integrating tree canopies in urban areas, emphasizing the influence of trees on temperature regulation and atmospheric moisture.
OUTCOME
Our final outcome was an A1 print, where we showed part of the process that we have been through:
Our final outcome was an A1 print, where we showed part of the process that we have been through:
- Understanding the environment outside the university
-
Creating the systems to collect de data with free software
-
Analyzing and retrieving the data from the servers
-
Visualizing the differences in data.
fVISUAL LANGUAGE
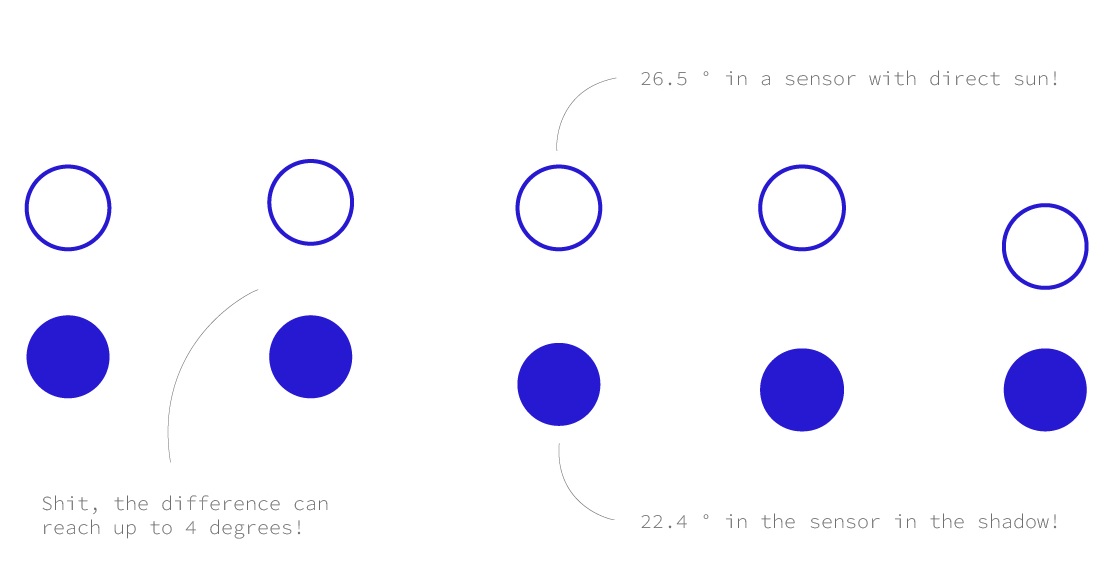
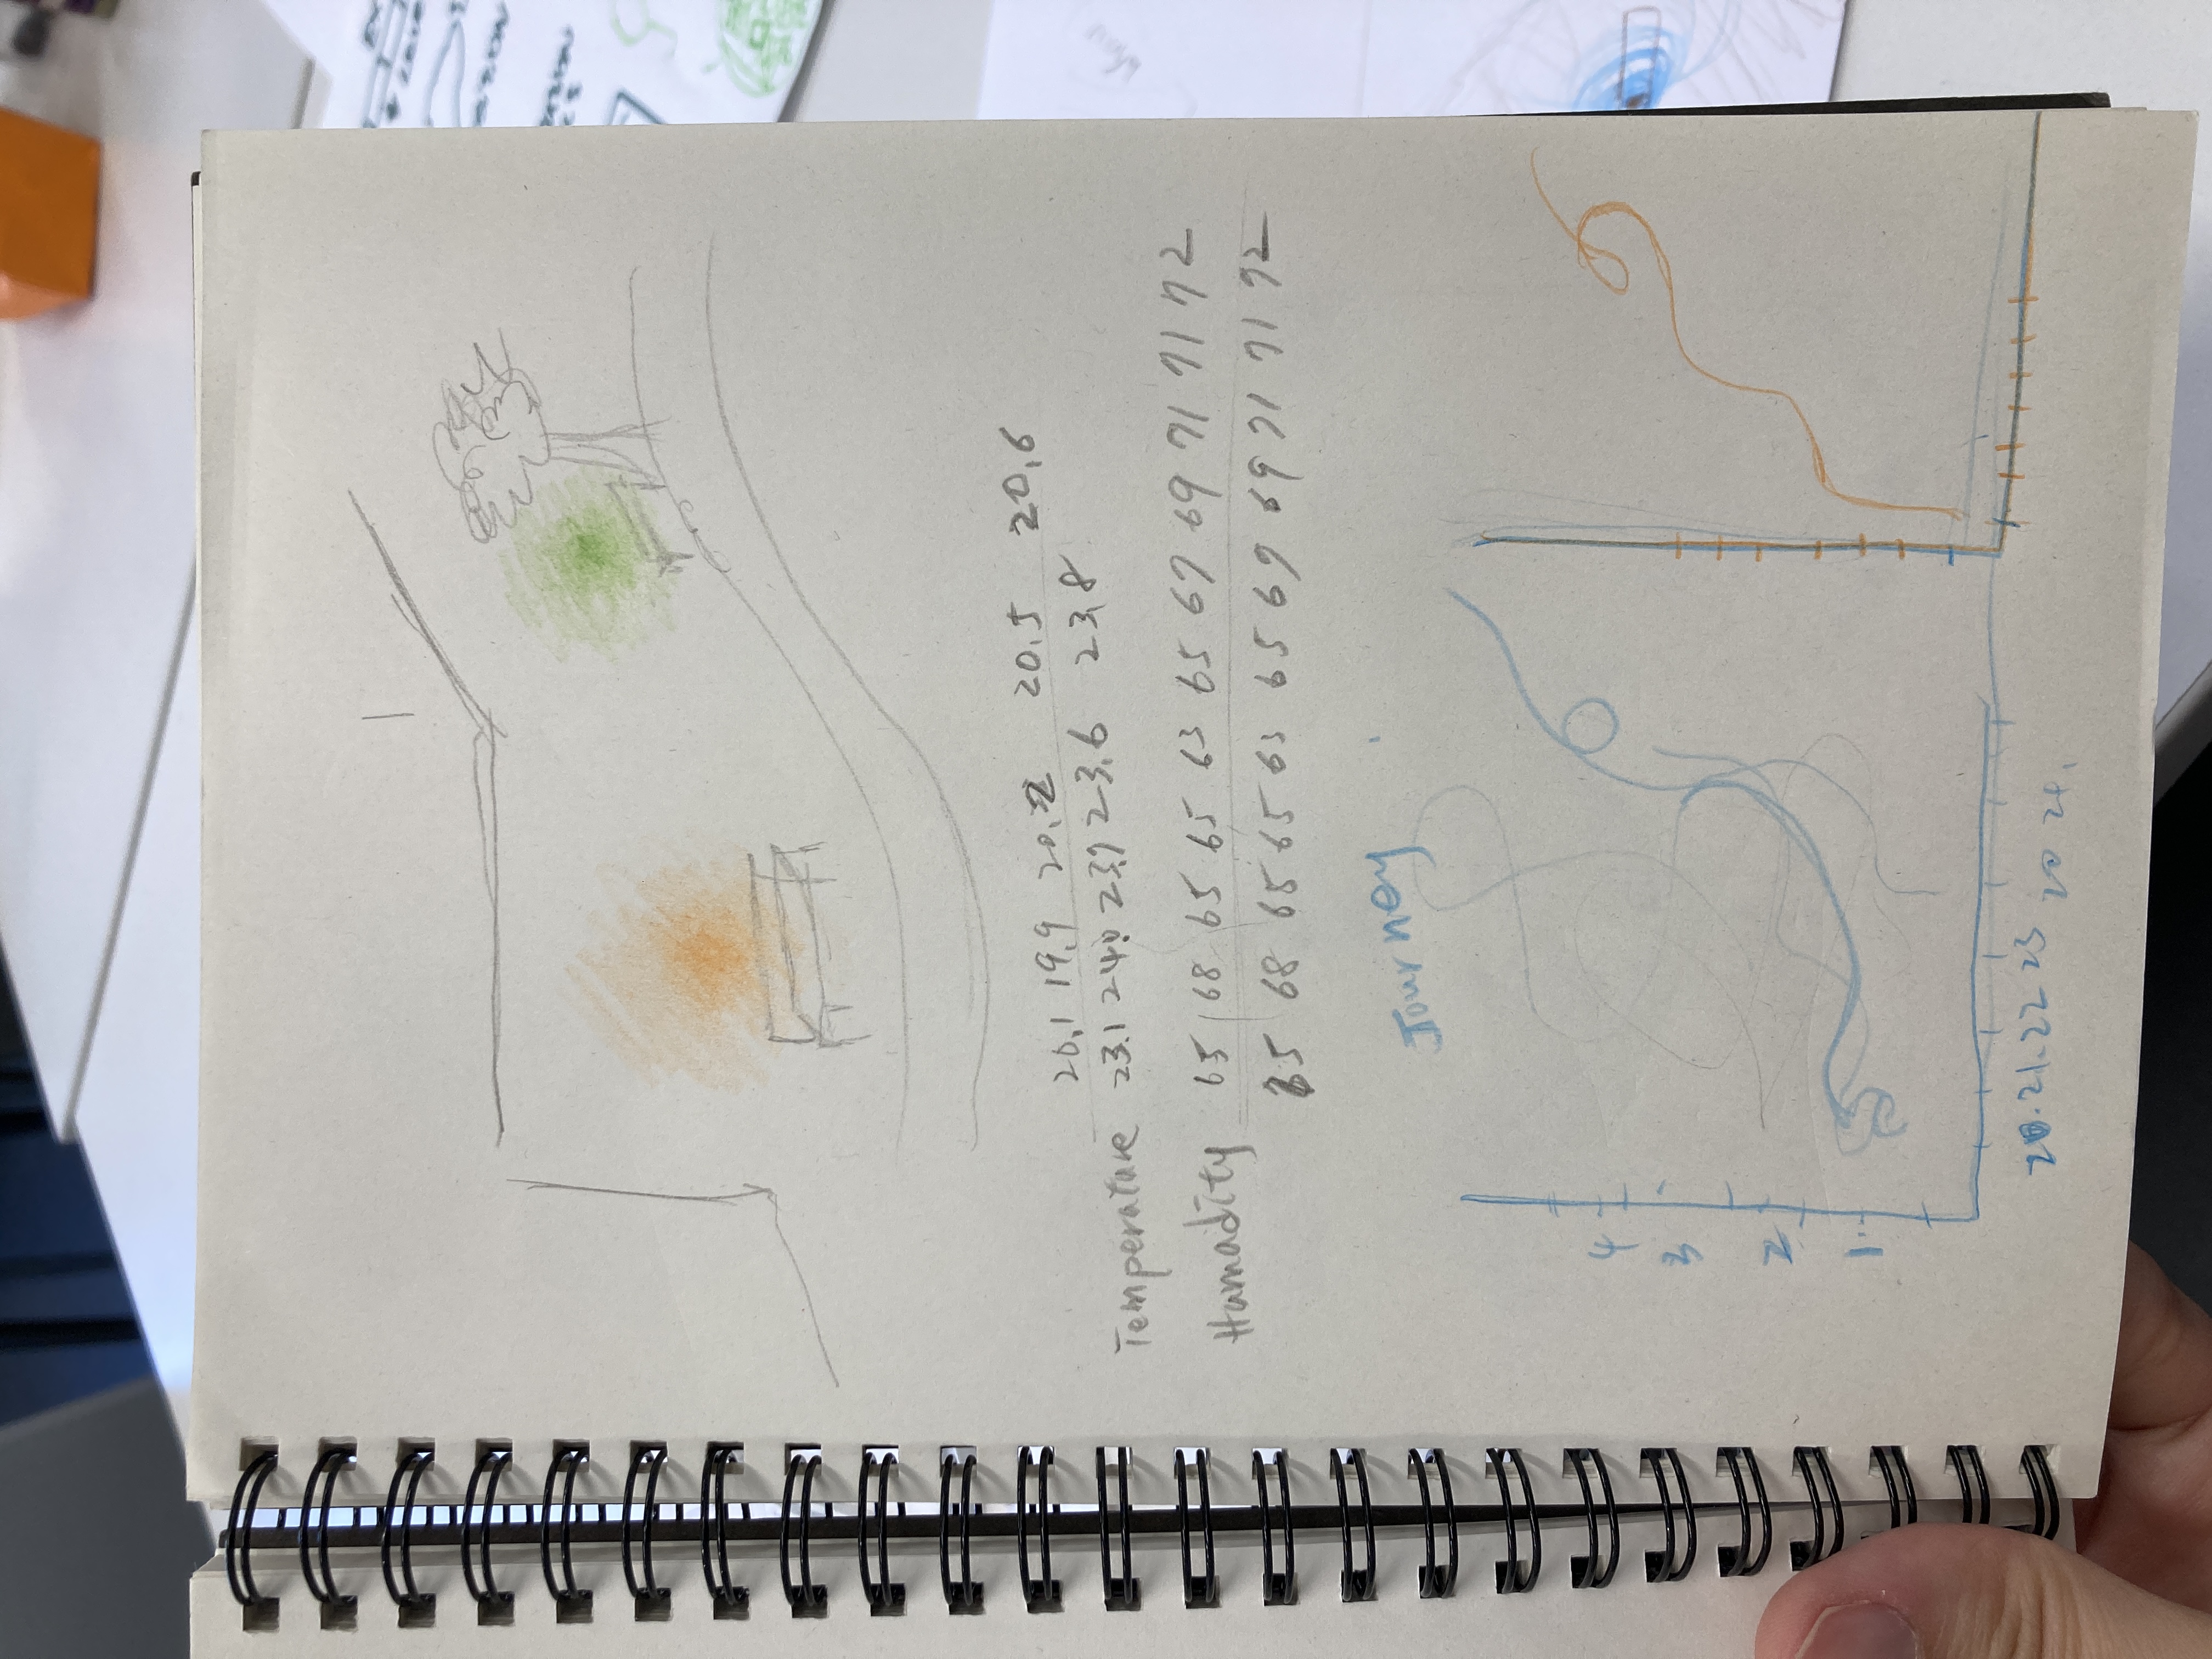
We created a point with the temperature every 10m.
︎ Sensor in the Shadow
︎ Sensor in the Sun
And plotted the difference in a way where it is easily recognizable that the difference between the temperature, and the sensor in the Sun records were higher.
![]()
In our quest for this result, we chose to speak in everyday language. We described our findings as a way to add a touch of artistry to our work, acknowledging that not everything we do is about coding and numbers.
We created a point with the temperature every 10m.
︎ Sensor in the Shadow
︎ Sensor in the Sun
And plotted the difference in a way where it is easily recognizable that the difference between the temperature, and the sensor in the Sun records were higher.
In our quest for this result, we chose to speak in everyday language. We described our findings as a way to add a touch of artistry to our work, acknowledging that not everything we do is about coding and numbers.
DATA COLLECTION
We collected the data on two benches in front of LLC in London, one, with and without a tree cover.
![]() We used our own recollection device and visualized the live data.
We used our own recollection device and visualized the live data.
![]()
![]()
![]()
We collected the data on two benches in front of LLC in London, one, with and without a tree cover.
 We used our own recollection device and visualized the live data.
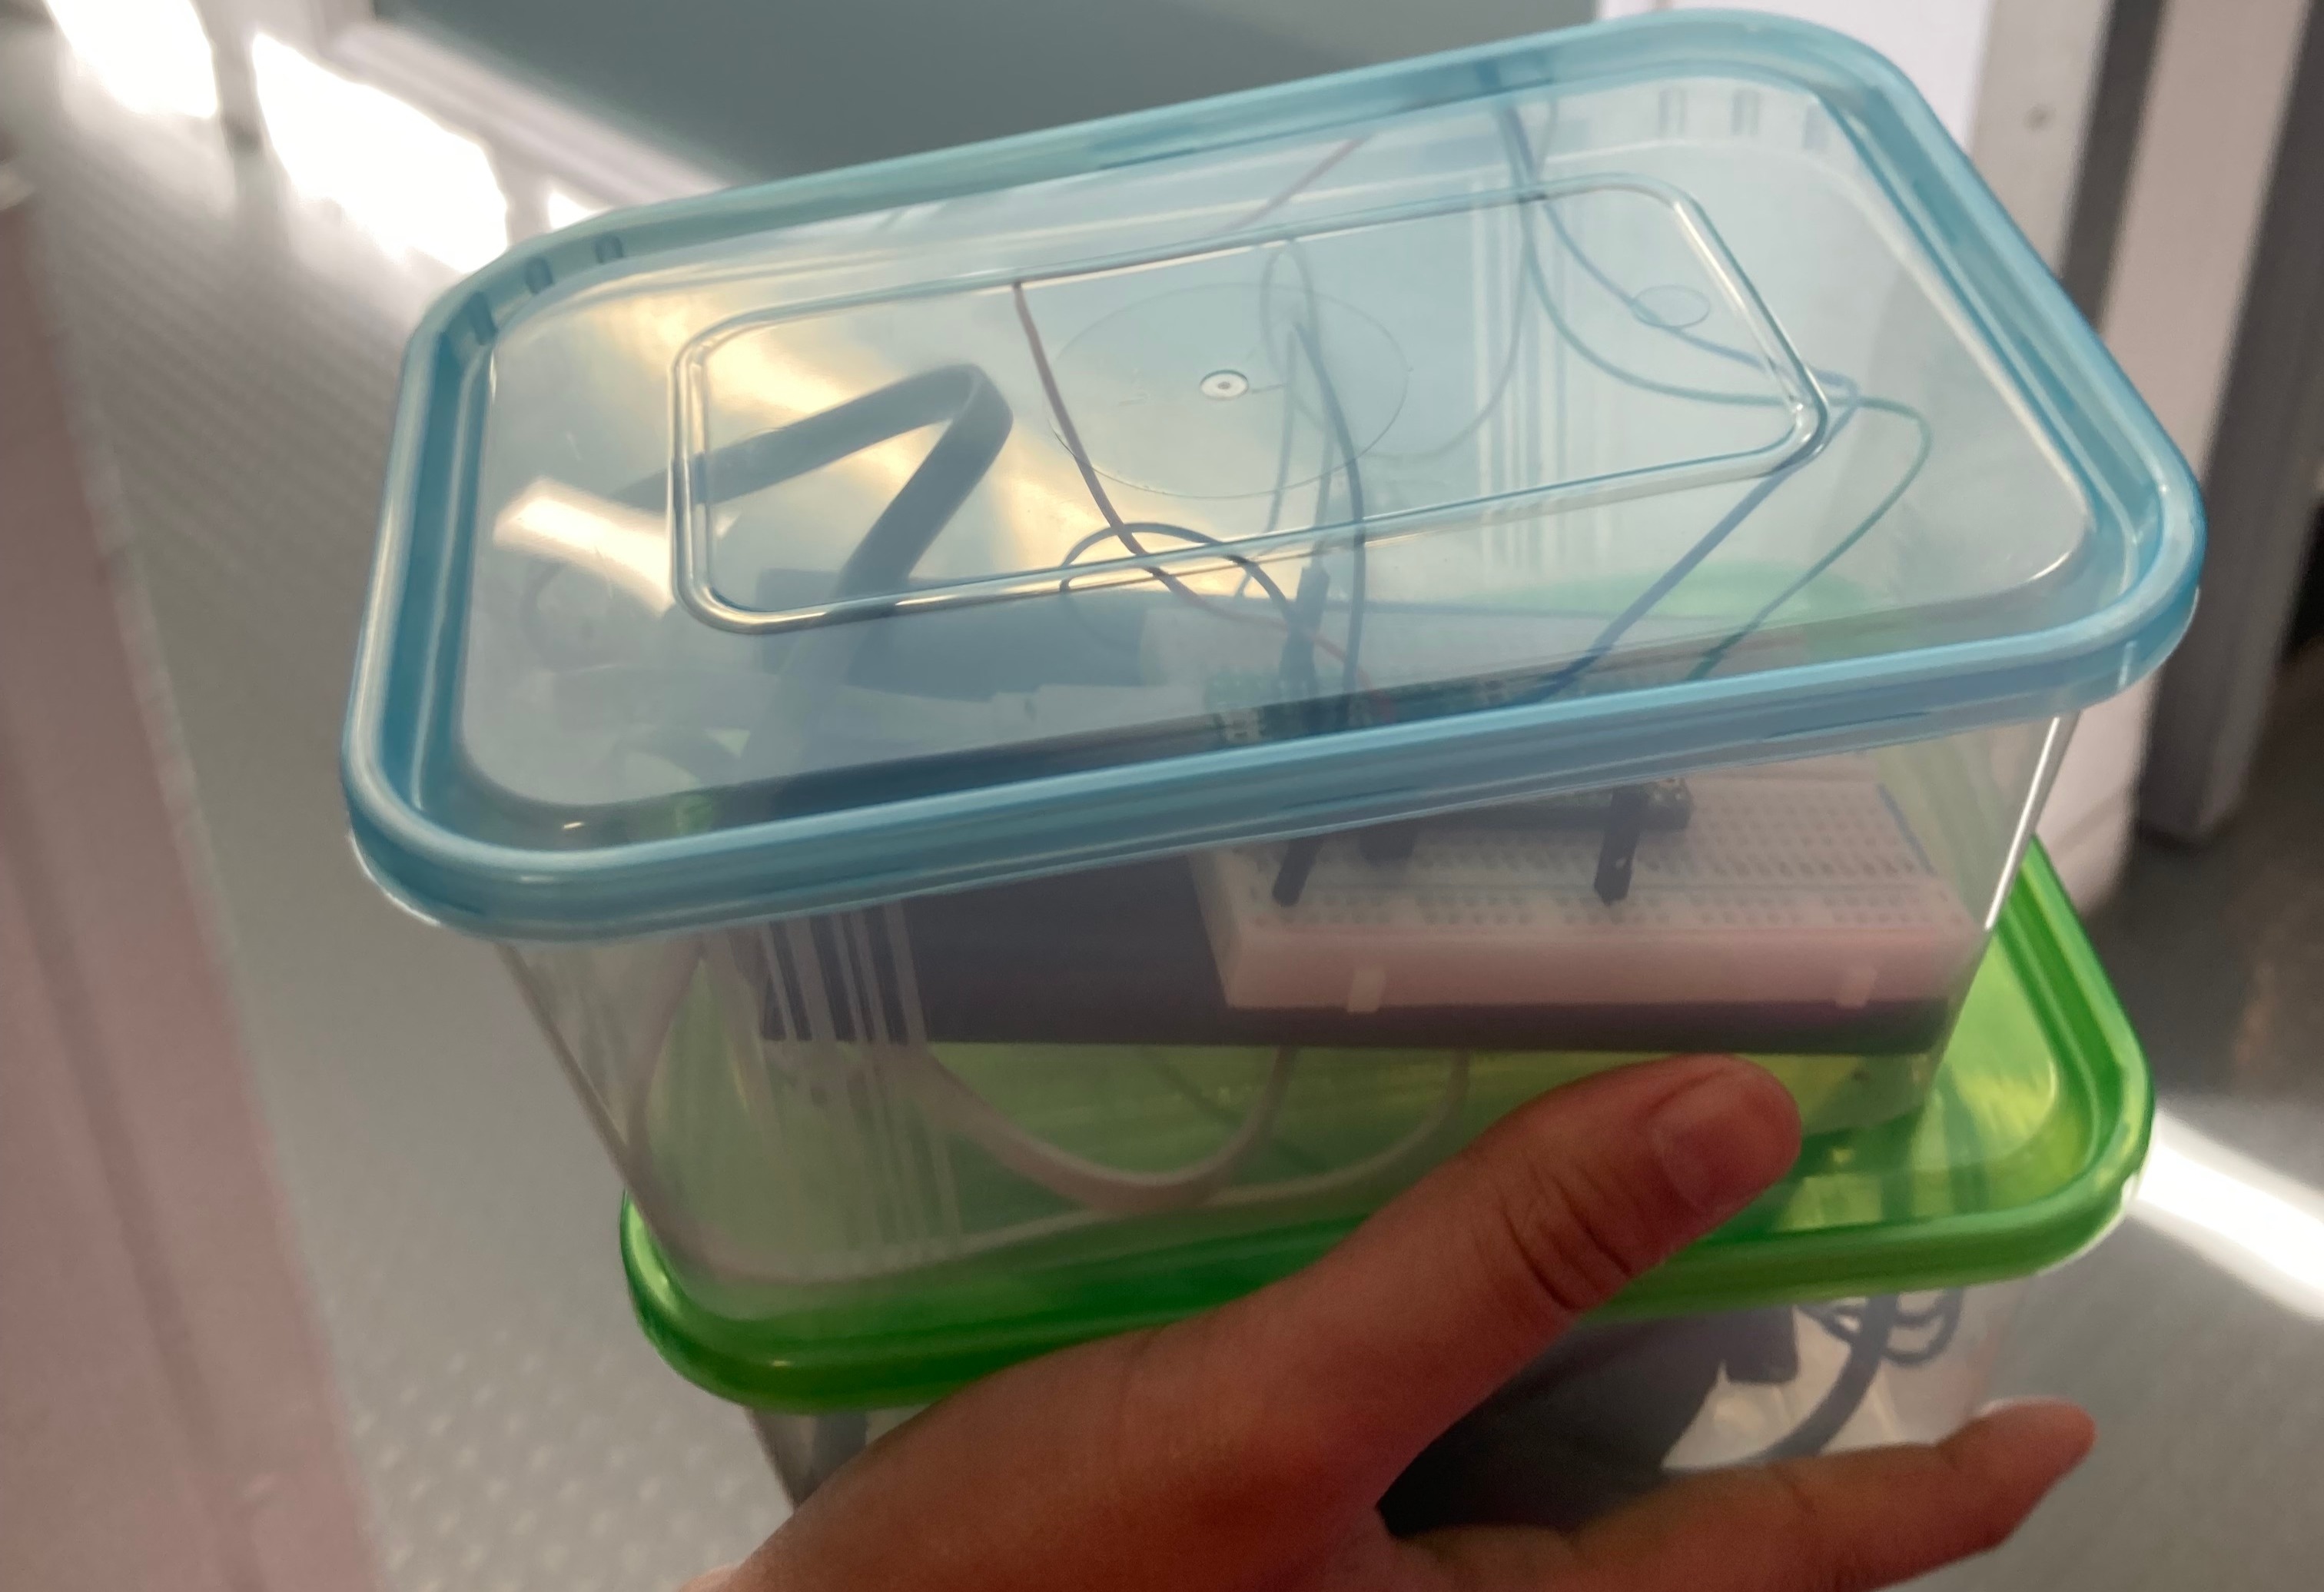

DATA PROCESSING
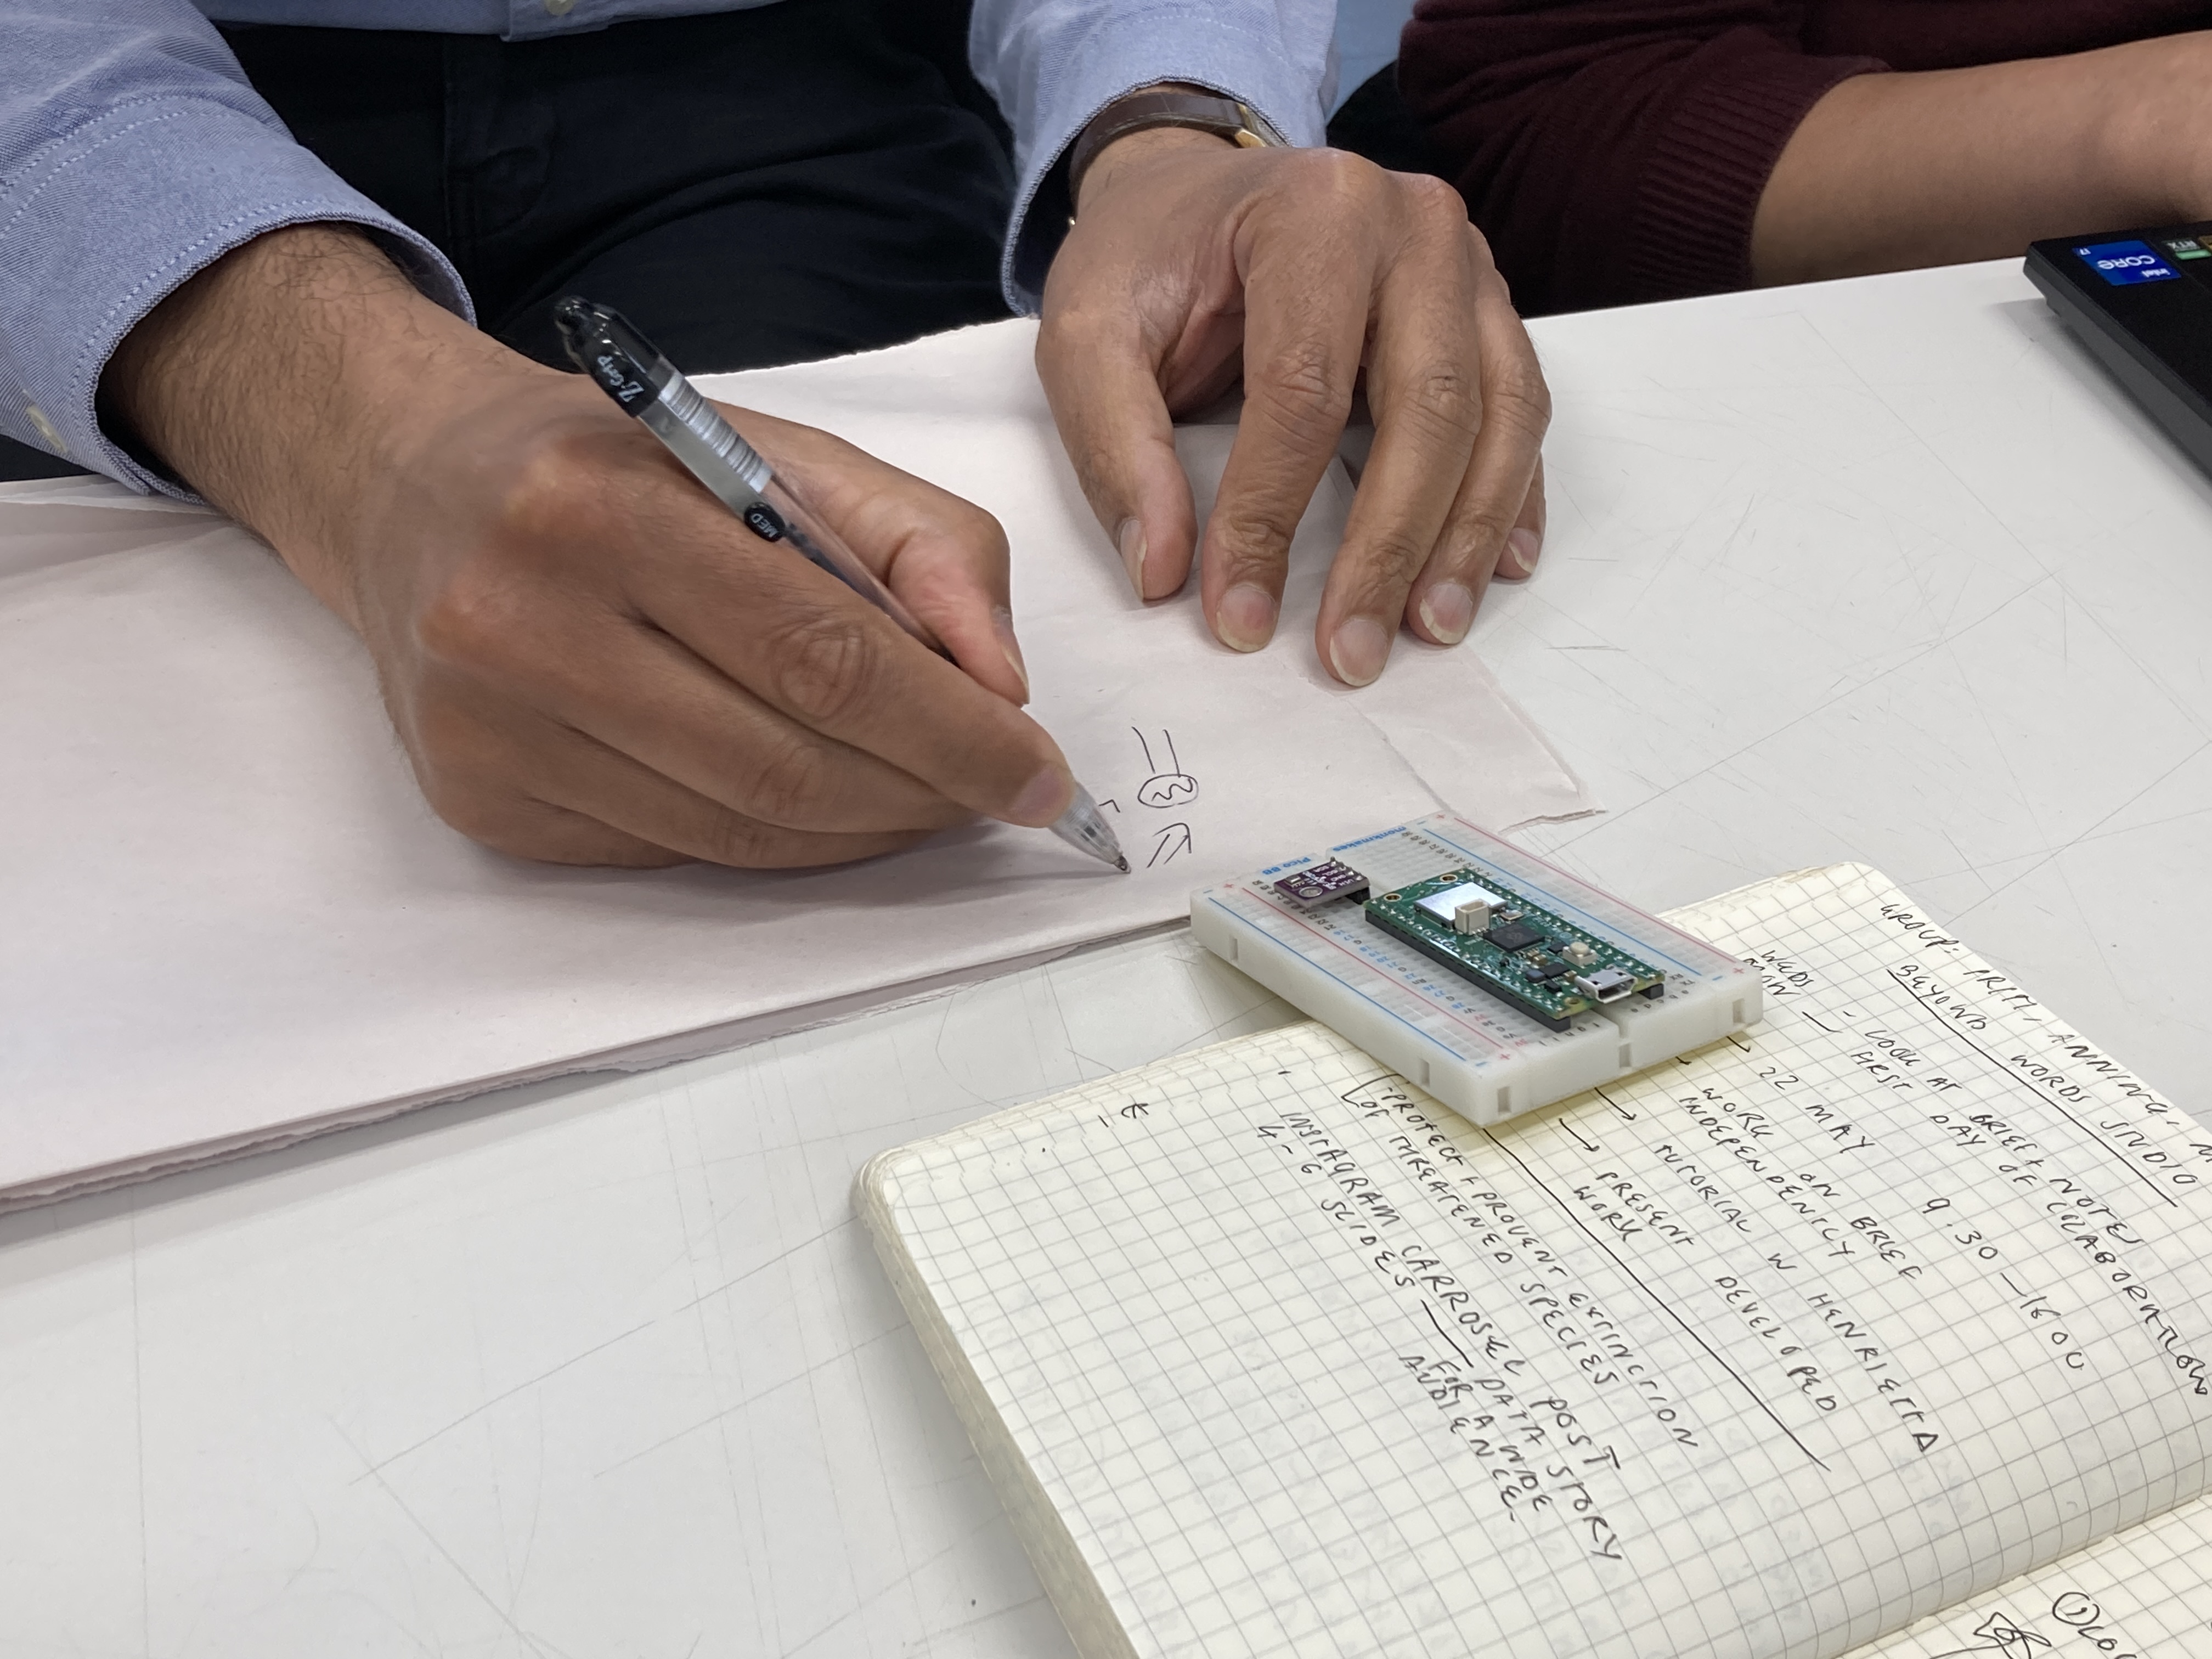
For this part we used a Raspberry Pi pico and a couple of sensors to collect the data, this process was made using Python.
![]()
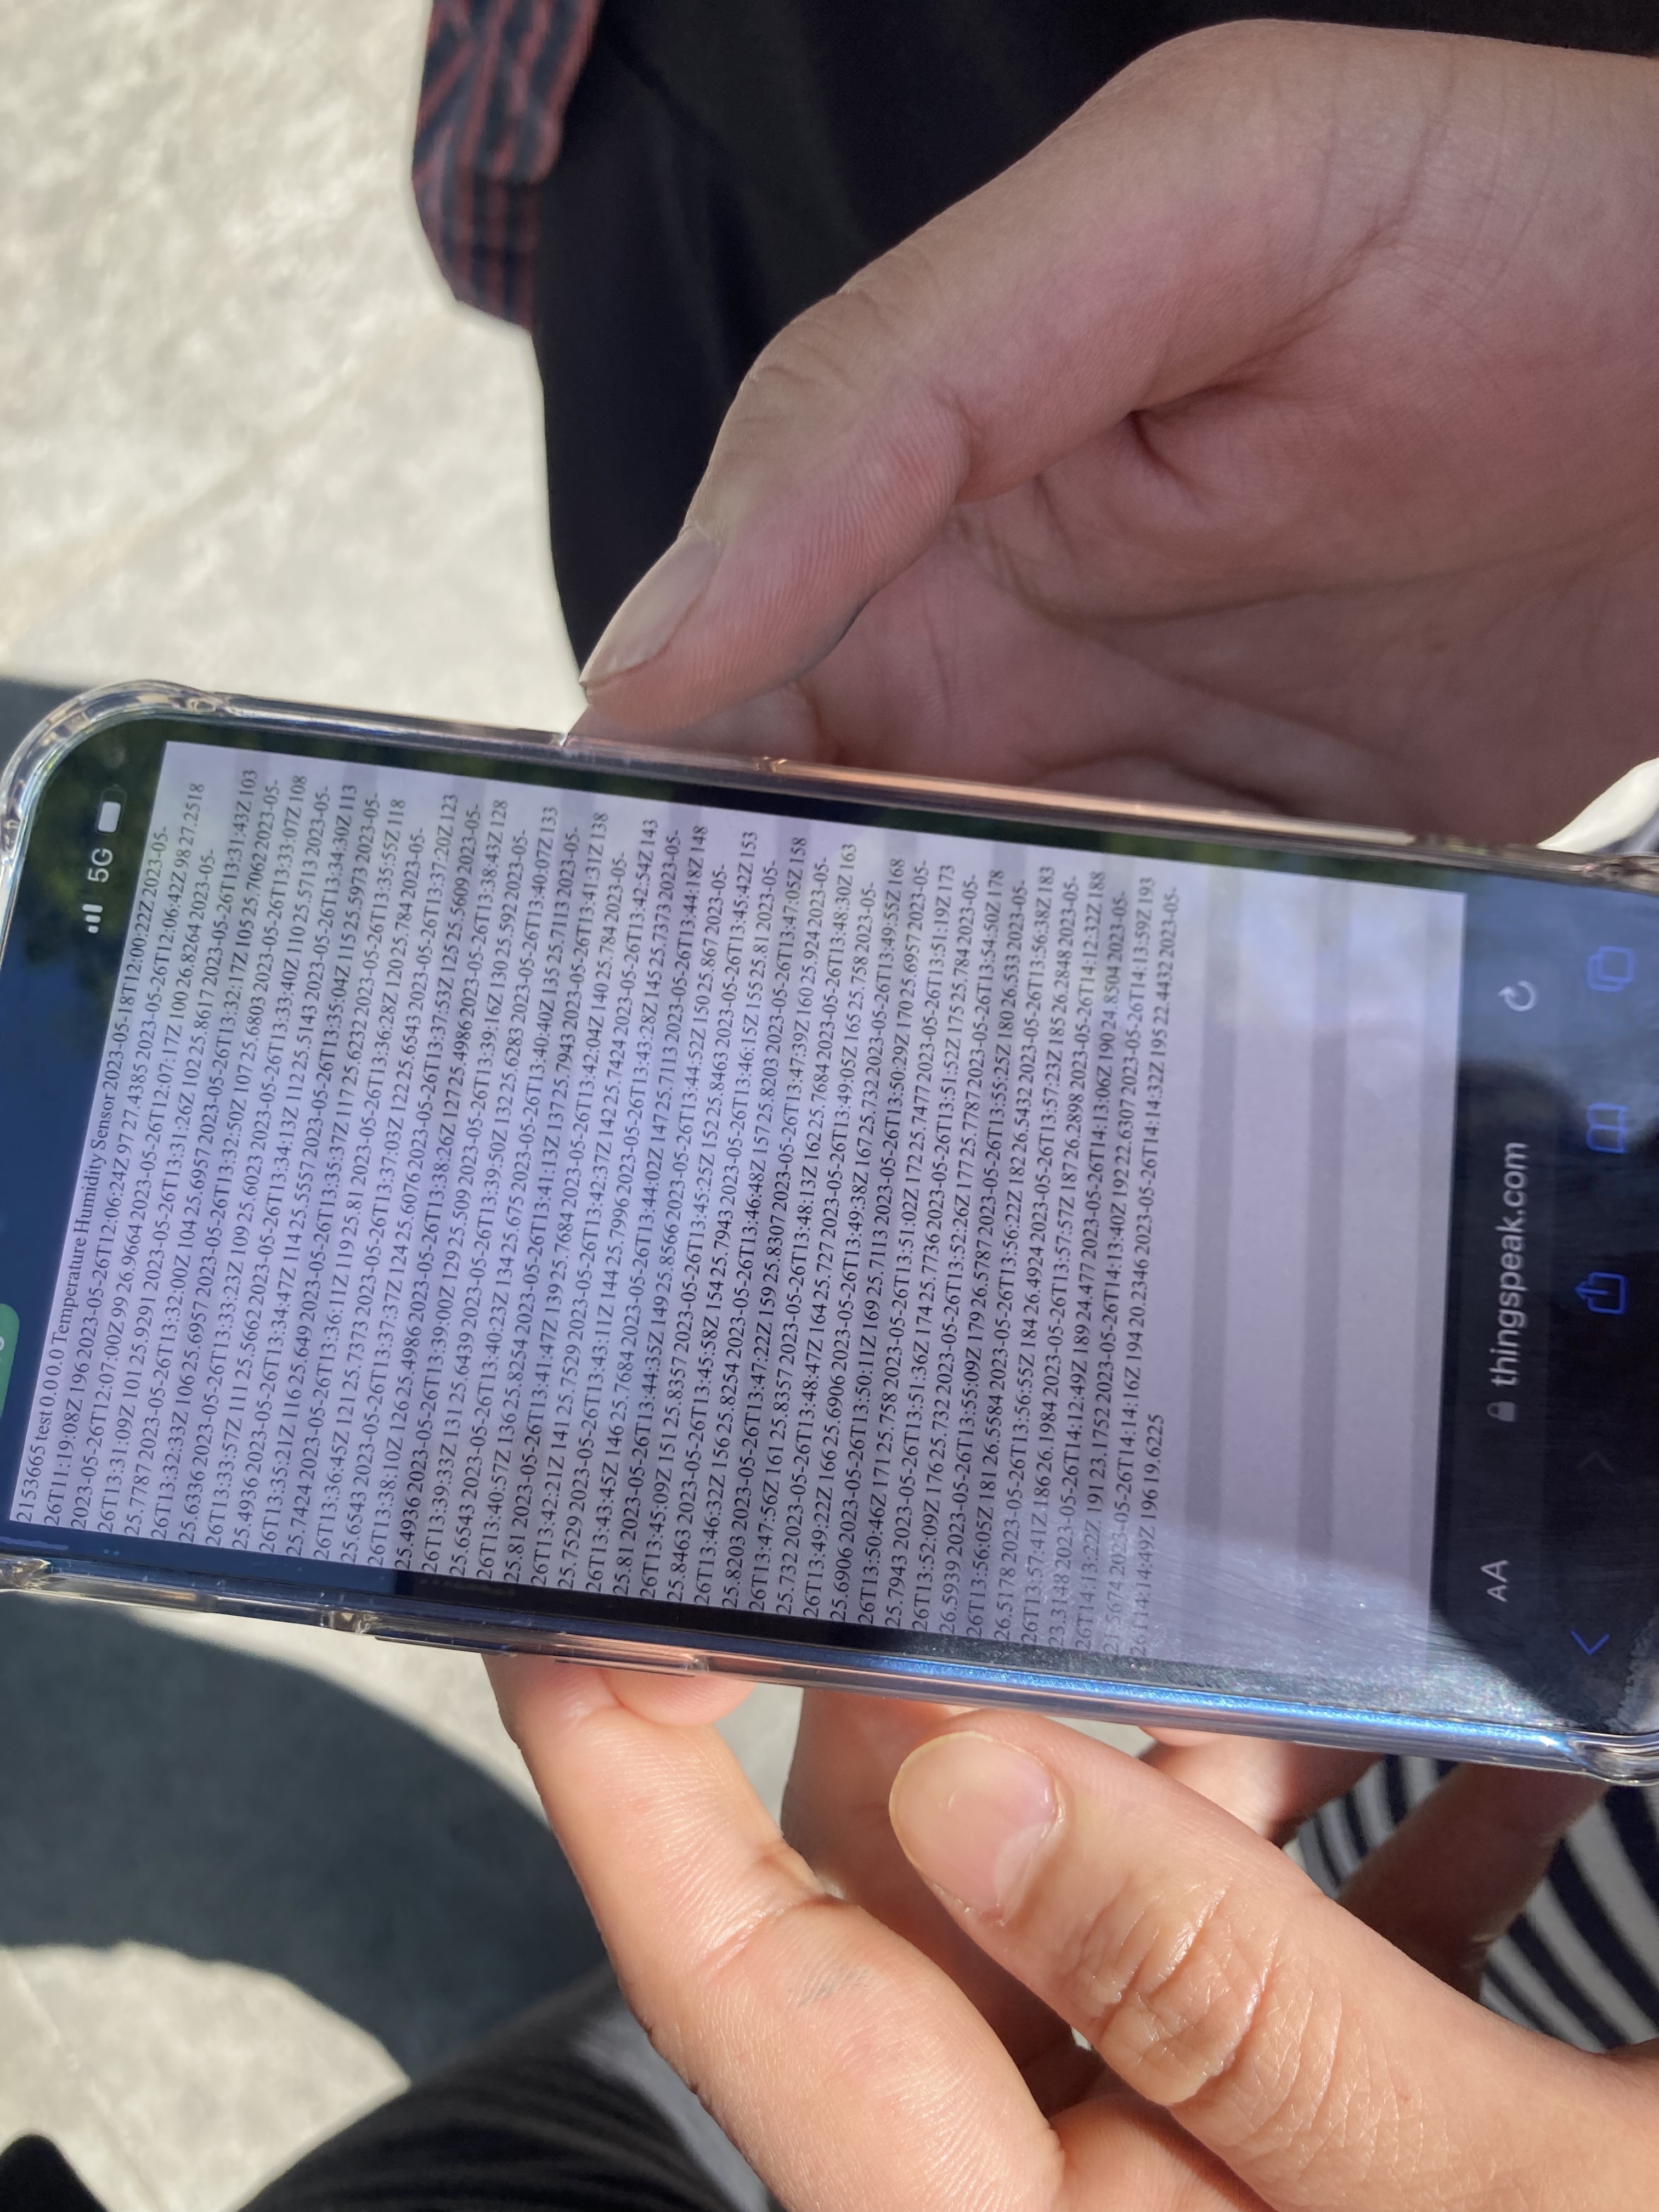
After that, we used ThingSpeak to store the temperature and humidity for the two sensors and have a live view of our data.
For this part we used a Raspberry Pi pico and a couple of sensors to collect the data, this process was made using Python.

DESIGN PROCESS
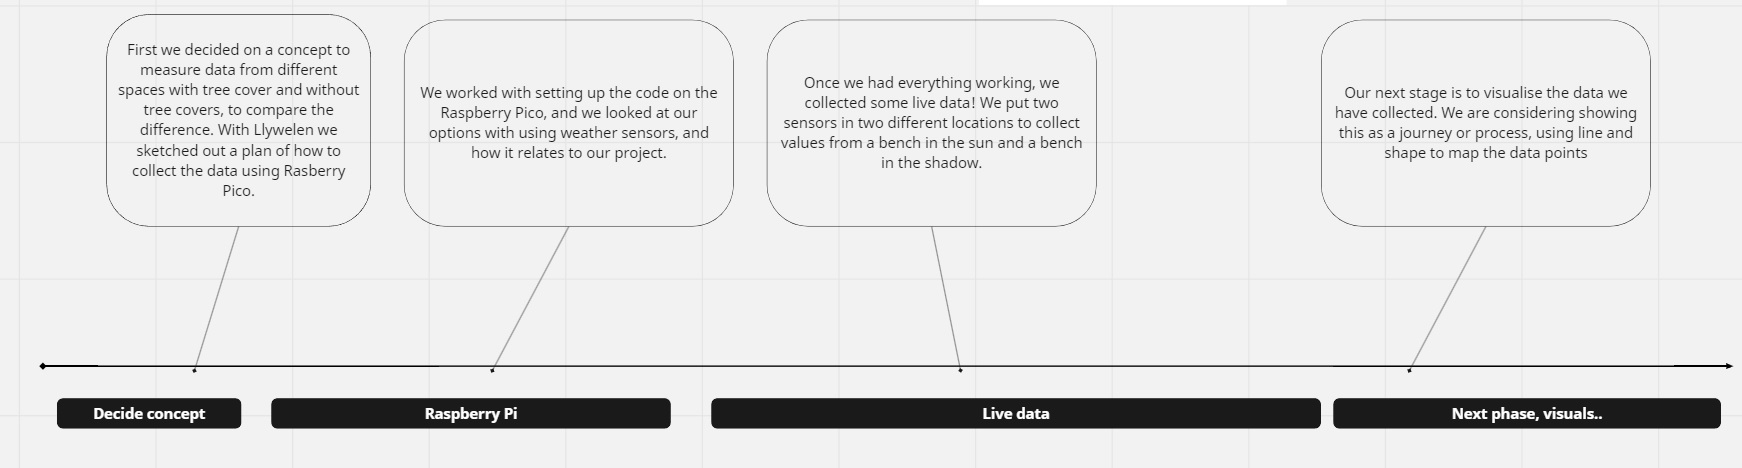
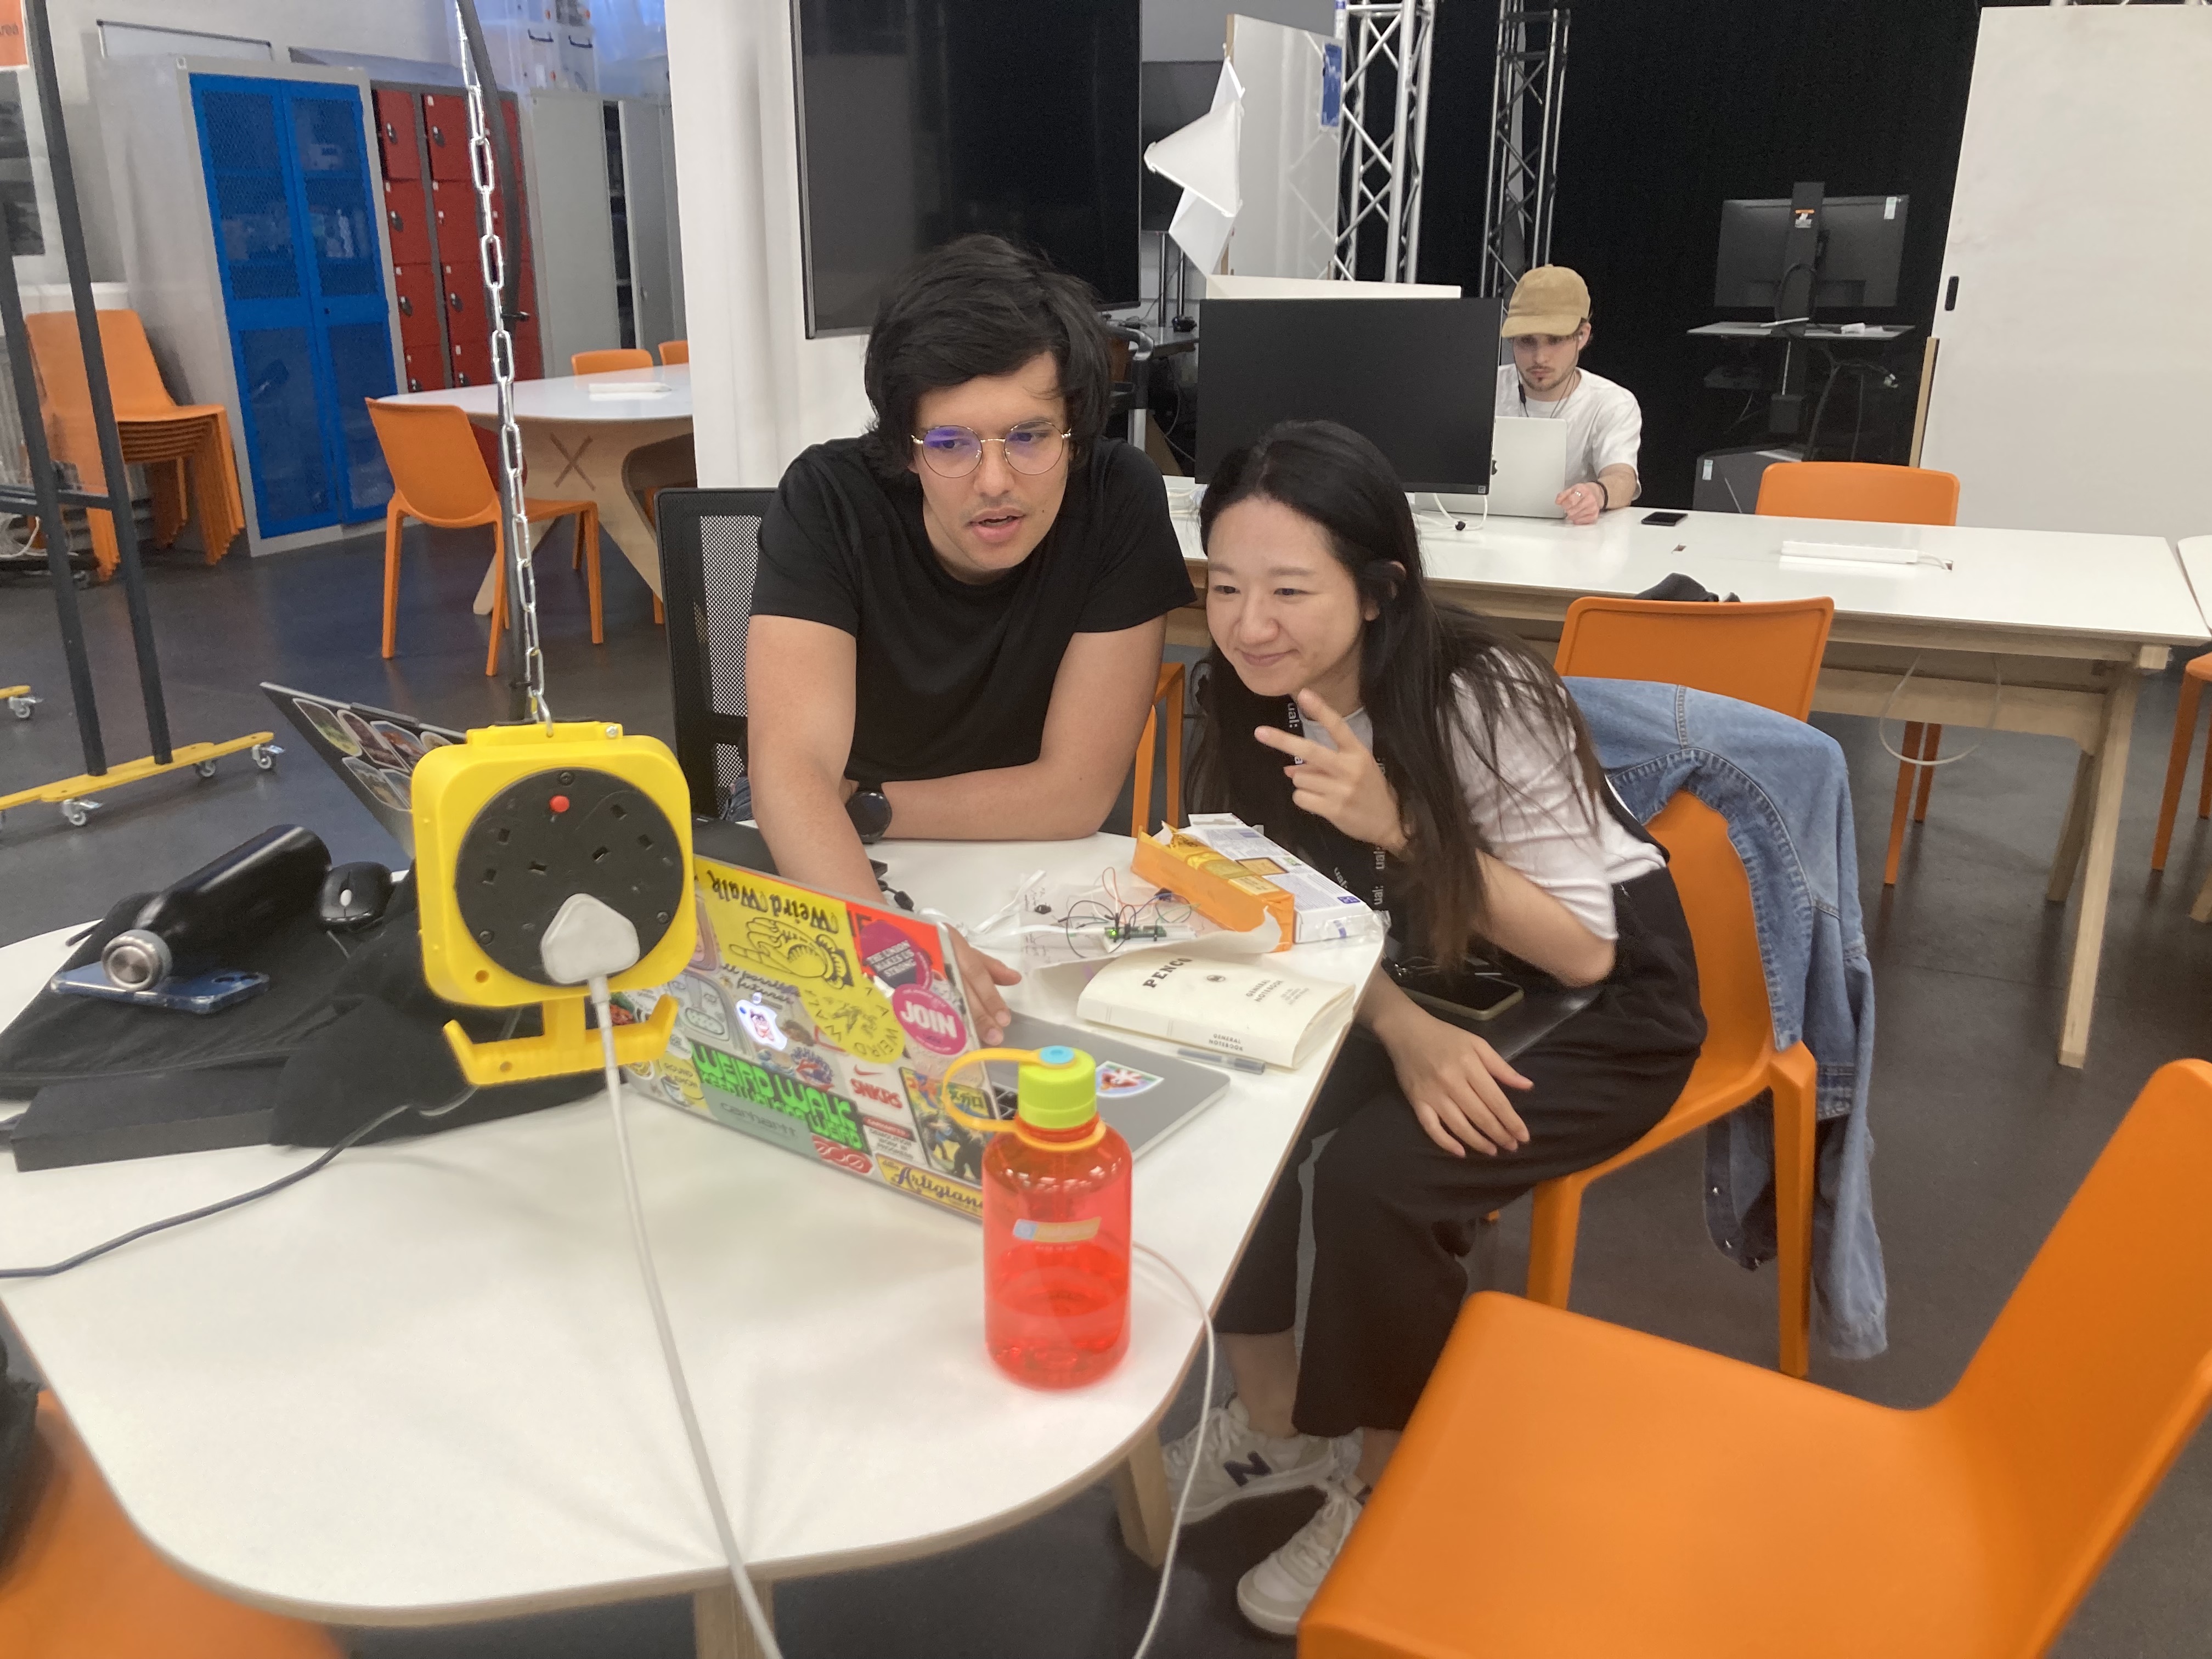
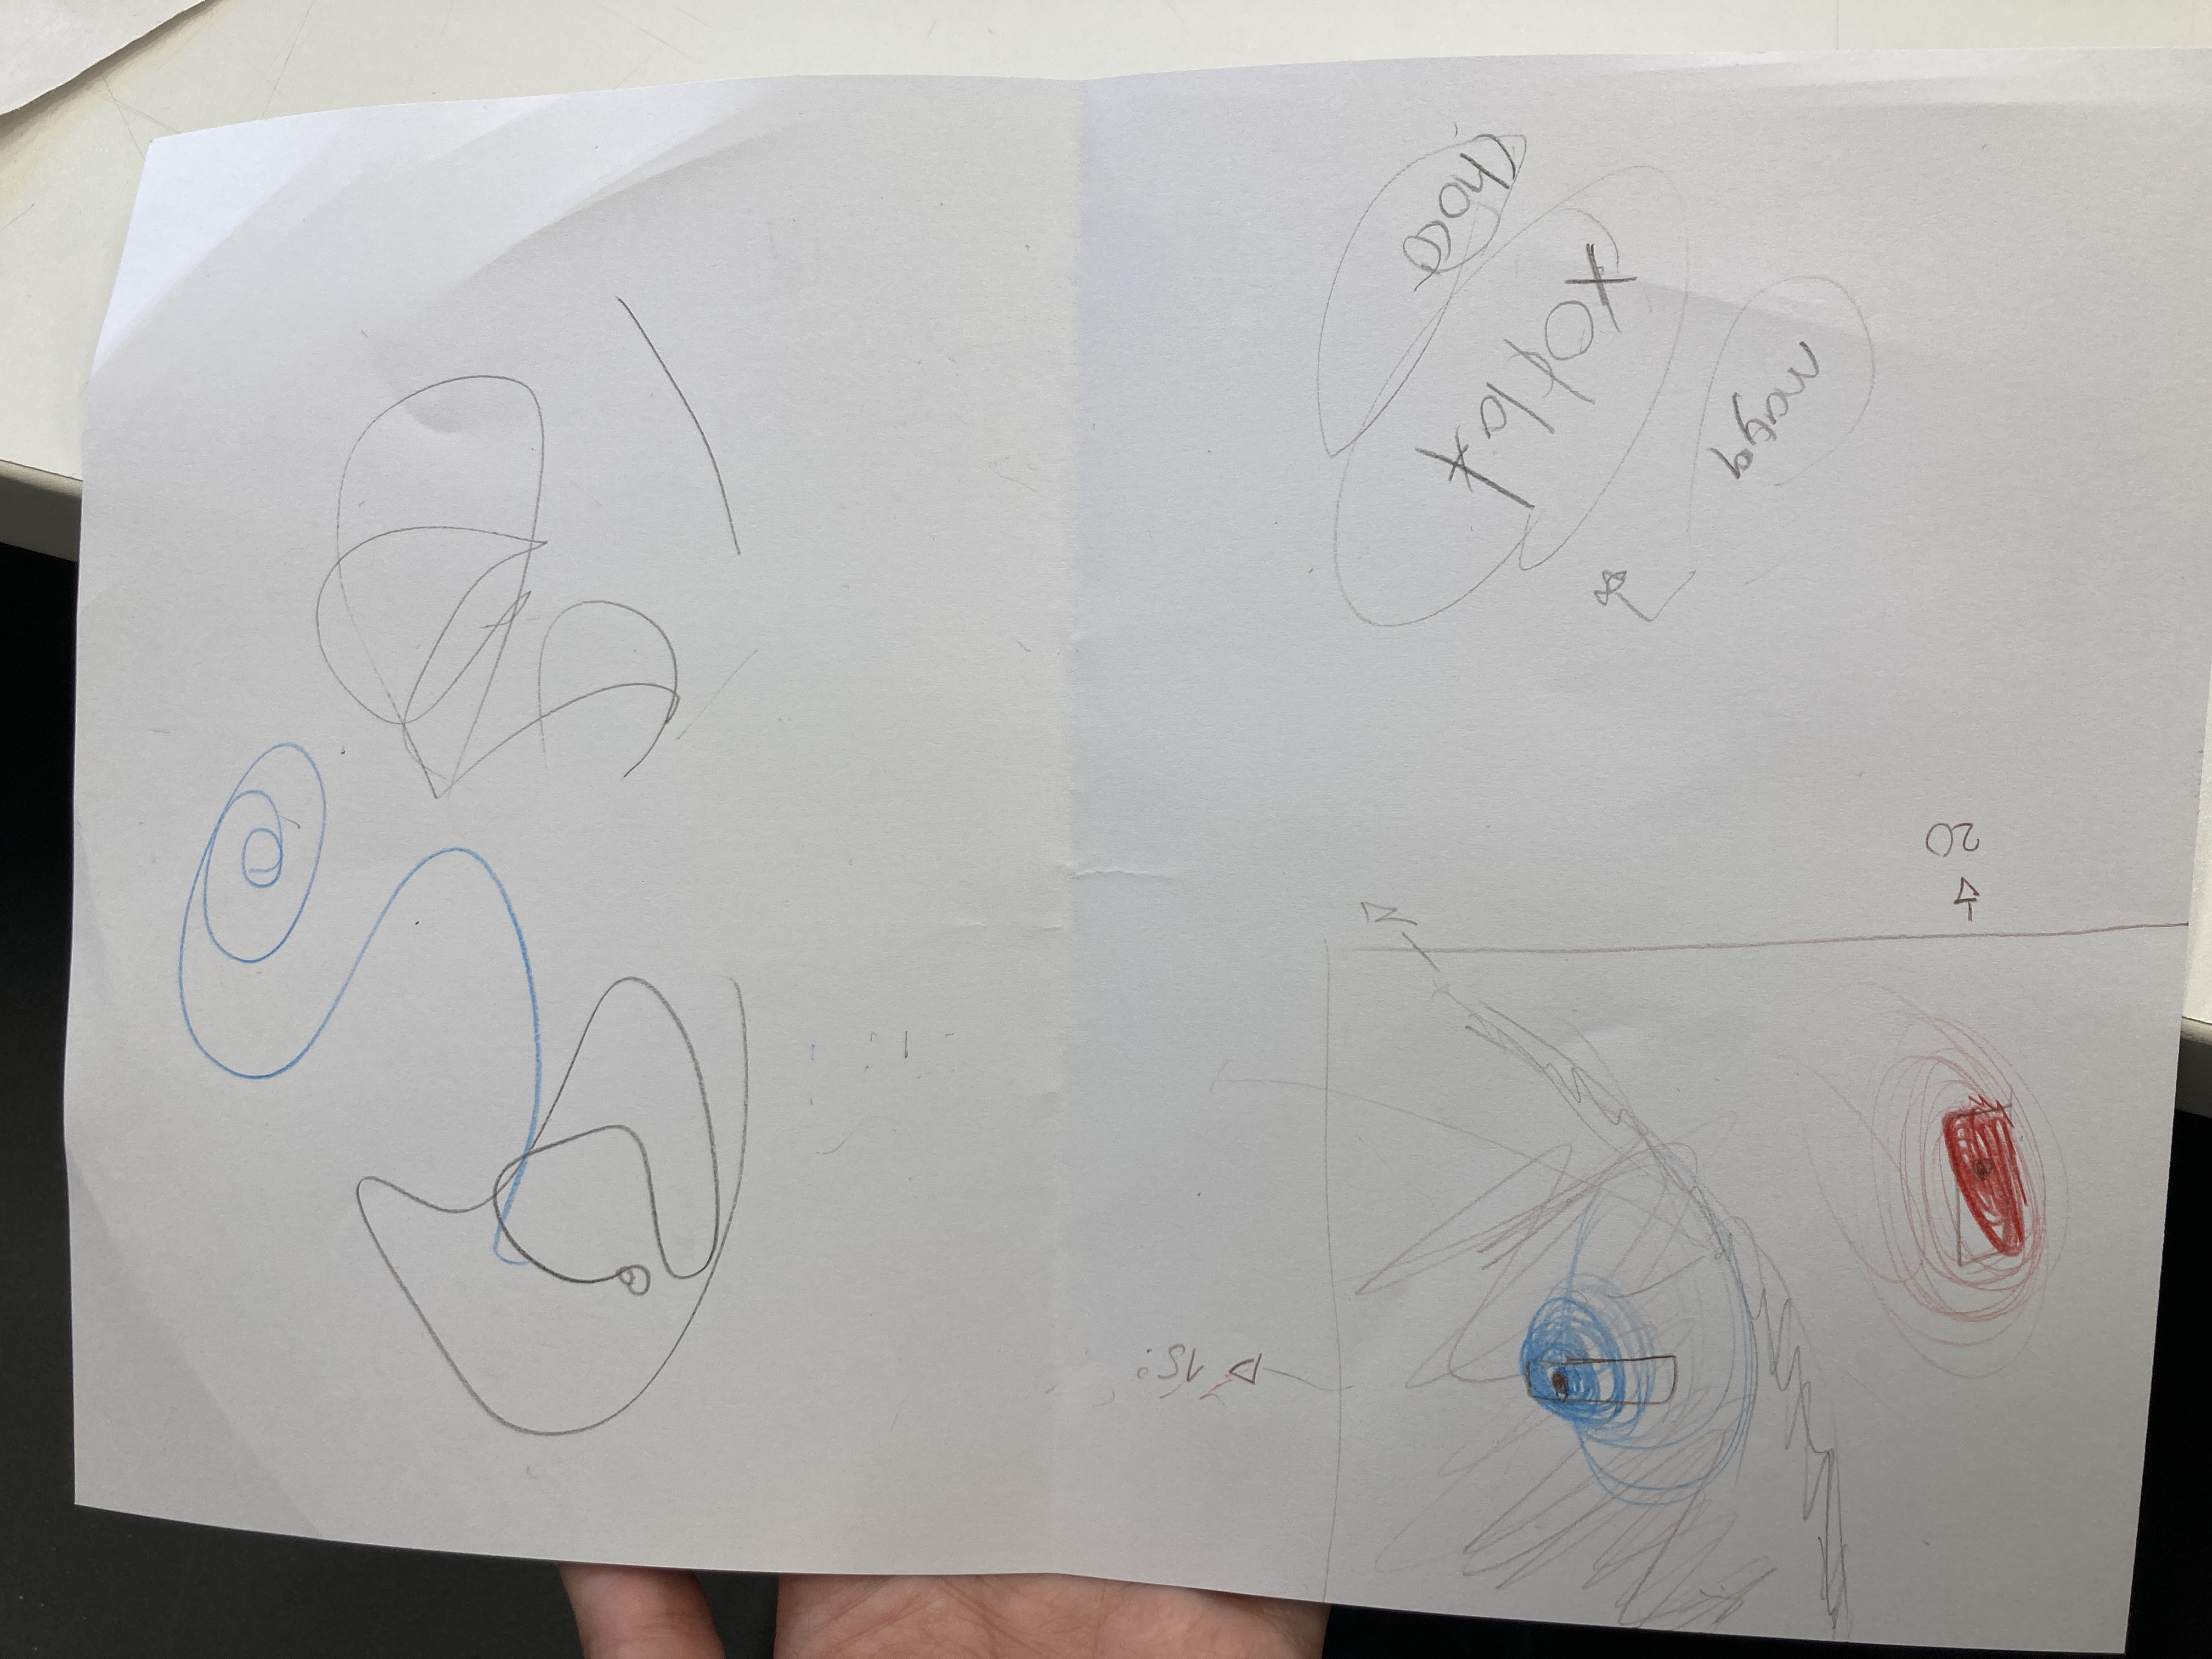
We started our journey walking around LCC, and trying to understand how the environmental data works and how we could collect it.
We also created a timeline and collected diverse visual references for visualizing environmental data.
![]()
![Process]()
![]()
![]()
Now, we are in the process of creating our project’s visual language.
![]()
![]()
Some of the images used in our design process were sourced from various authors and media. While these images were relevant to our research and design, it is important to note that we do not claim intellectual property rights for them.
We started our journey walking around LCC, and trying to understand how the environmental data works and how we could collect it.
We also created a timeline and collected diverse visual references for visualizing environmental data.
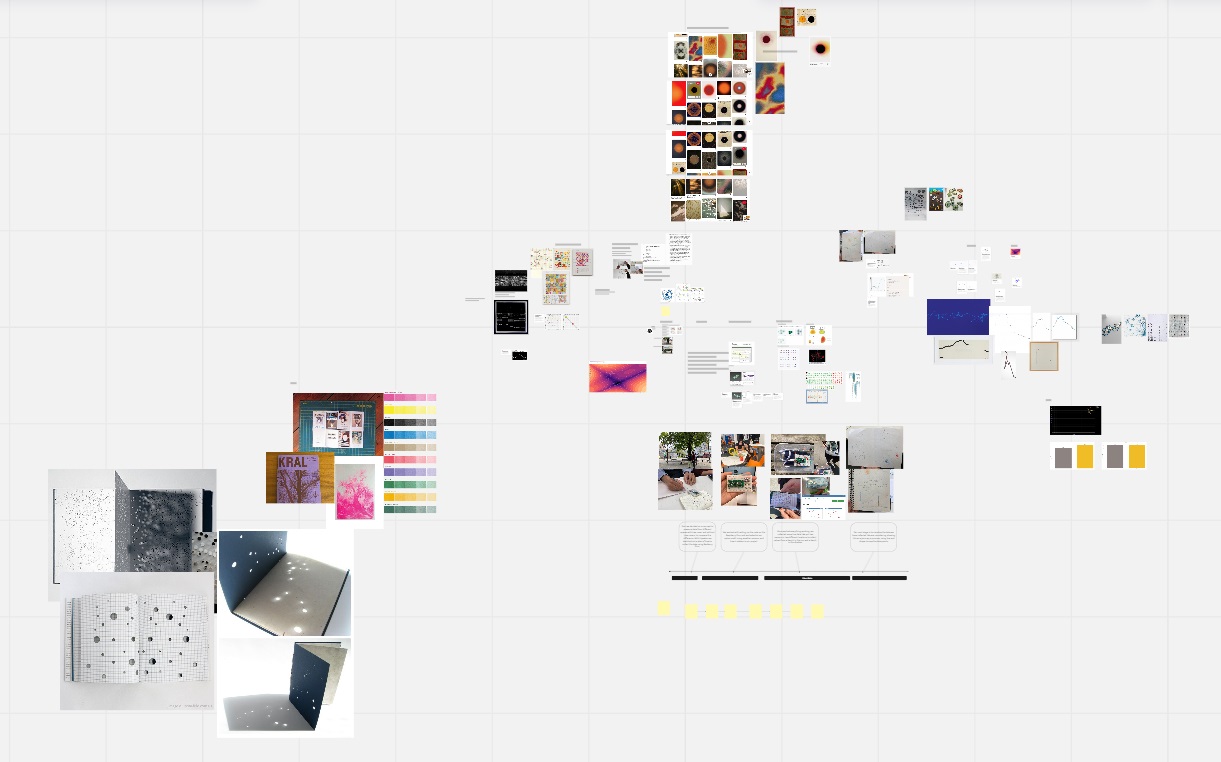
Now, we are in the process of creating our project’s visual language.
Some of the images used in our design process were sourced from various authors and media. While these images were relevant to our research and design, it is important to note that we do not claim intellectual property rights for them.